Trade Monitoring
Helping operation teams monitor the progress of trades by bubbling up actionable trades and showing clients that their trades are getting processed smoothly.
Responsibilities included:
- UX interviews
- Research Synthesis
- Documenting Requirements
- Prototyping
- Presentations
The Problem
Clients had no idea how to use the trade dashboard that BNY Mellon had built to help them see what our operations teams were doing for them.
Clients had no idea how to use the trade dashboard that BNY Mellon had built to help them see what our operations teams were doing for them. In the event that they did finally read through the pages of guides and training, they experienced more hurdles while looking at the dashboard. One of which was the confusing terminology and misrepresented trade lifecycle process. On top of that, the delayed data caused them to mistrust the information. The false view into the number of issues to resolve caused clients to revert back to relying on email exchanging Excel files of trade exceptions with our operations team to get things done.
“We need to interact with clients as if we’re sitting next to each other.”
Project Team
I worked alongside a UX Manager, Project Manager, Business Analyst, Middle Office Trade subject matter expert (SME), and a Lead Developer. This was a 7 week UX consultation with our Middle Office department to produce an interactive prototype to show clients.
User Interviews
The UX manager and I conducted 12 user interviews total, 6 with our operations specialists and 6 with clients.
We reviewed the existing dashboard solution and familiarized ourselves with the terminology with lessons from business experts. The UX manager and I conducted 6 user interviews with operations specialists from our company and 6 user interviews with clients. From the notes we produced two personas to help us understand the operation specialist and client perspectives.
Findings
Confusion over why totals didn't match up and lost faith with the data presented
Unable to see that trades are moving along in the process which caused them to send multiple follow up emails
Trades exceptions weren't noticeable because they were hidden within the interface
Wanted to see trade status details as well as BNY Mellon's status on handling trade exceptions
Needed to search for trades by multiple facets, not just one
Ideation Phase
Through ideation sketches, it was clear that both operations and clients wanted to view visualizations that focused on flow and quantity to help them see that trades move through the lifecycle.
The visualization for the trade lifecycle needed to:
show flow through a system
show different paths/transfers through a set of stages
display proportional quantity of items moving
clearly show input, output, and problems
d3.js capable
Solution
Bubble up fails and problems that require follow-up actions which replaces the manual reports sent twice a day.
The dashboard now showcases the sankey diagram that helps show the flow of trades and that trades are getting processed. Additionally it bubbles up fails and problems that require follow-up actions which replaces the manual and static problem reports our operations team sends out twice a day. Instead of a static update, users can see the trade history updates live and use the search and filters to find items that matter.
Showing flow and trade amounts across lifecycle
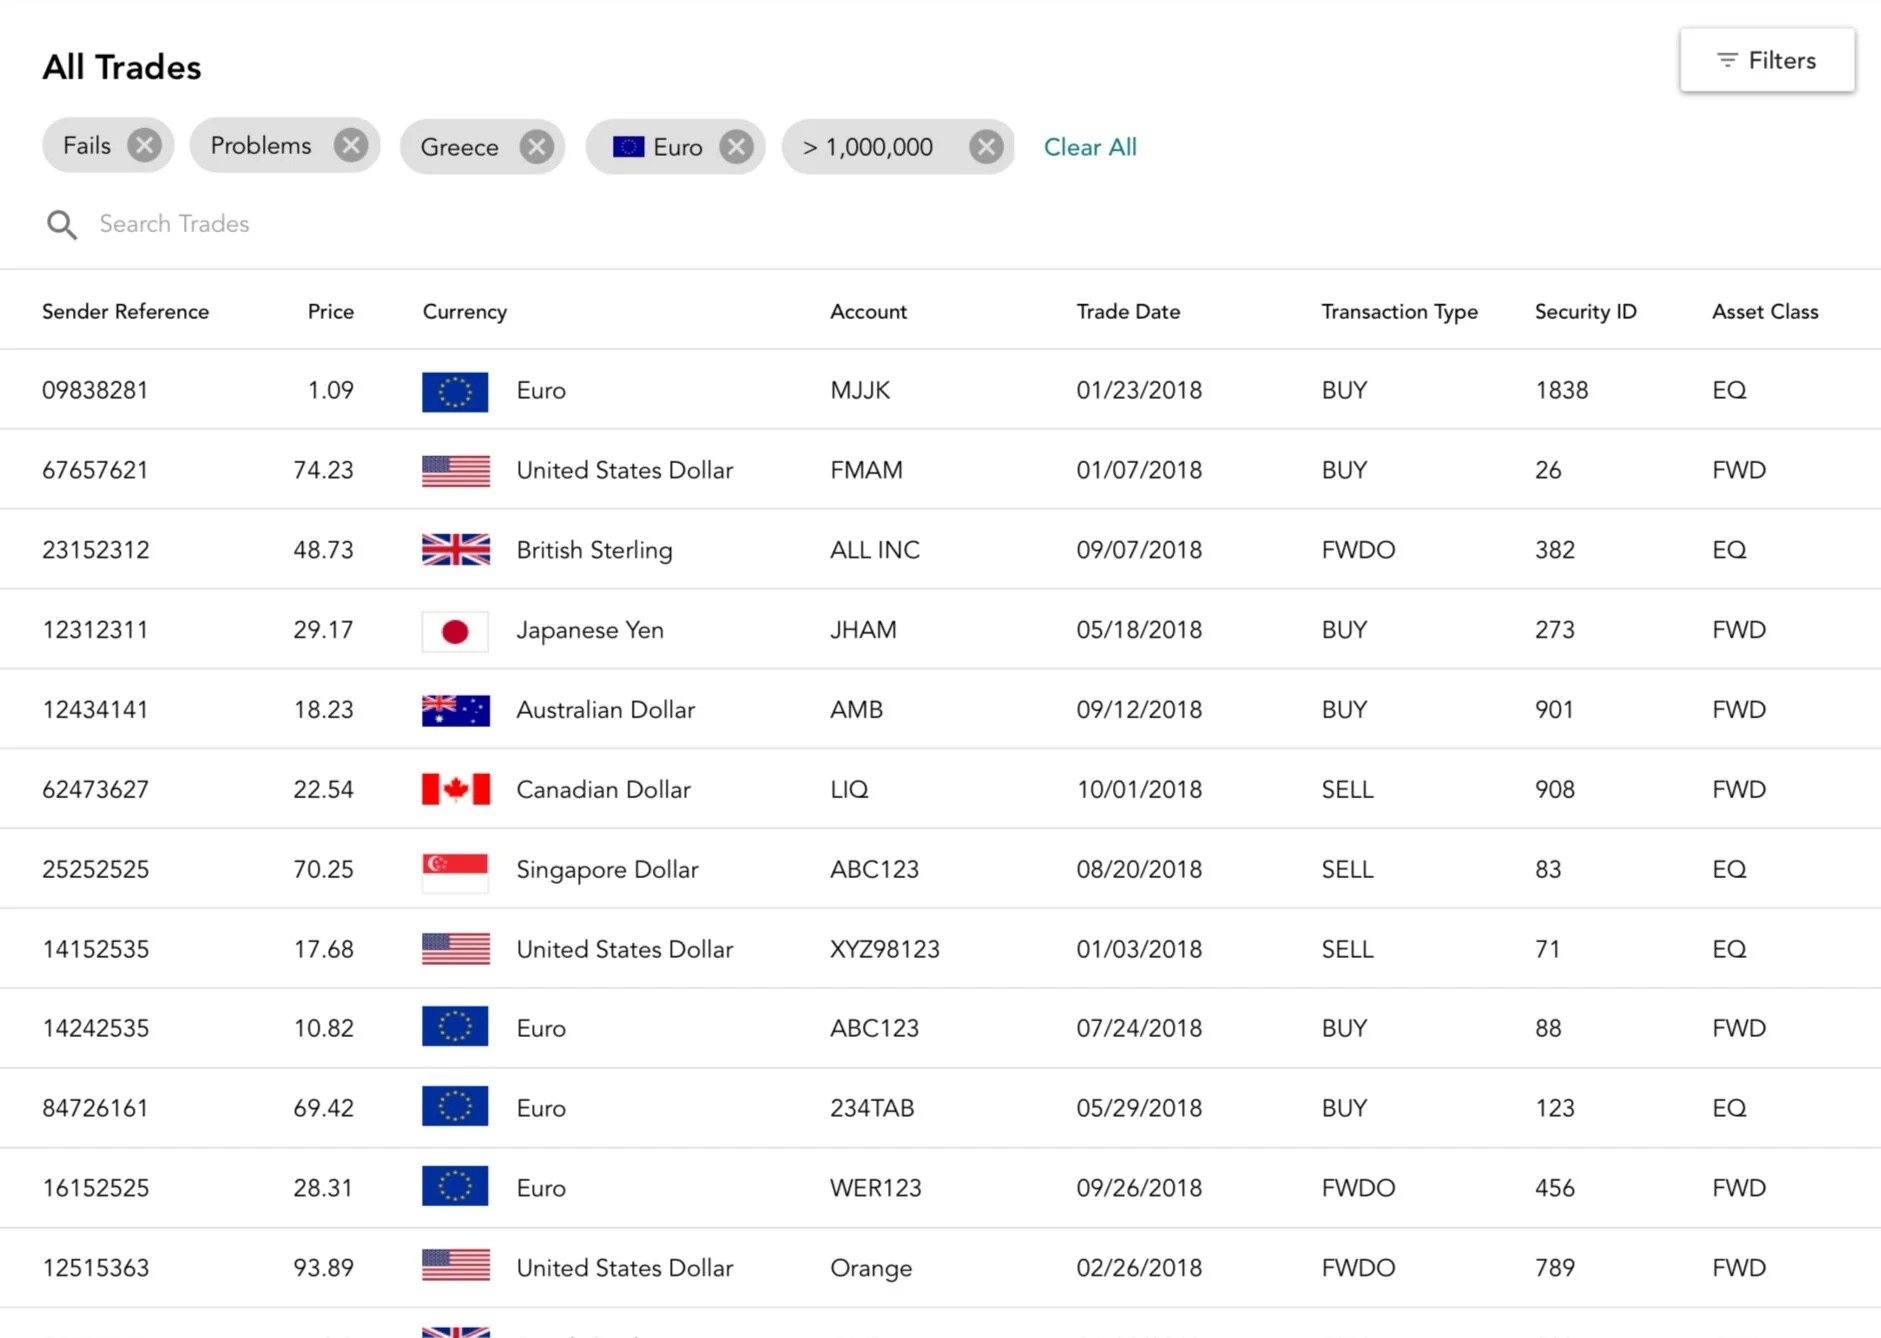
Filter & find trades
Specialists are looking for blocks of trades that need their attention so they know what to work on next.
Displays filter selections
Mobile Support
The operations team members are used to checking in with their clients trades from their morning commute to before they go to bed.
Results
We proved to the Middle Office department the value of incorporating UX into their business revamp. After this seven week consultation we launched three new projects with this department.
I learned to get concrete examples of tasks and scenarios that people encounter so that I always have that in mind while designing.
Next Steps
Explore concept of trade dictionary for all the financial lingo
Ability to watch specific trade
Integrate alerts for trades you're watching
Integrate with Symphony chat
Saved filters concept
Design usability test and gather clients for individual sessions


