Prediction API
A web app dashboard tool for API usage and patterns across Data Science.
Responsibilities included:
- Requirements gathering
- UX Design
- Data Visualization
The Problem
Data Engineering and Data Scientists were often piecing together information on a data issue through various disjointed services.
Many of the Data Science products developed with partners across the organization rely on API calls to data science models. With new updates to these models, the Data Engineering team and Data Scientists were often piecing together information on a data issue through various disjointed services. They needed a way to visualize these data issues with a way to locate the exact API request as one experience.
Goal
Increase visibility of API usage data and reveal patterns for the Data Engineering team and for Data Scientists troubleshooting a broken model.
After interviewing the 2 stakeholders, 1 executive, and 2 data scientists. We uncovered the many tools and paths they use to troubleshoot a data issue. It became clear that this project needed to increase the visibility of API usage data and reveal patterns for the Data Engineering team and for Data Scientists troubleshooting a broken model in one experience.
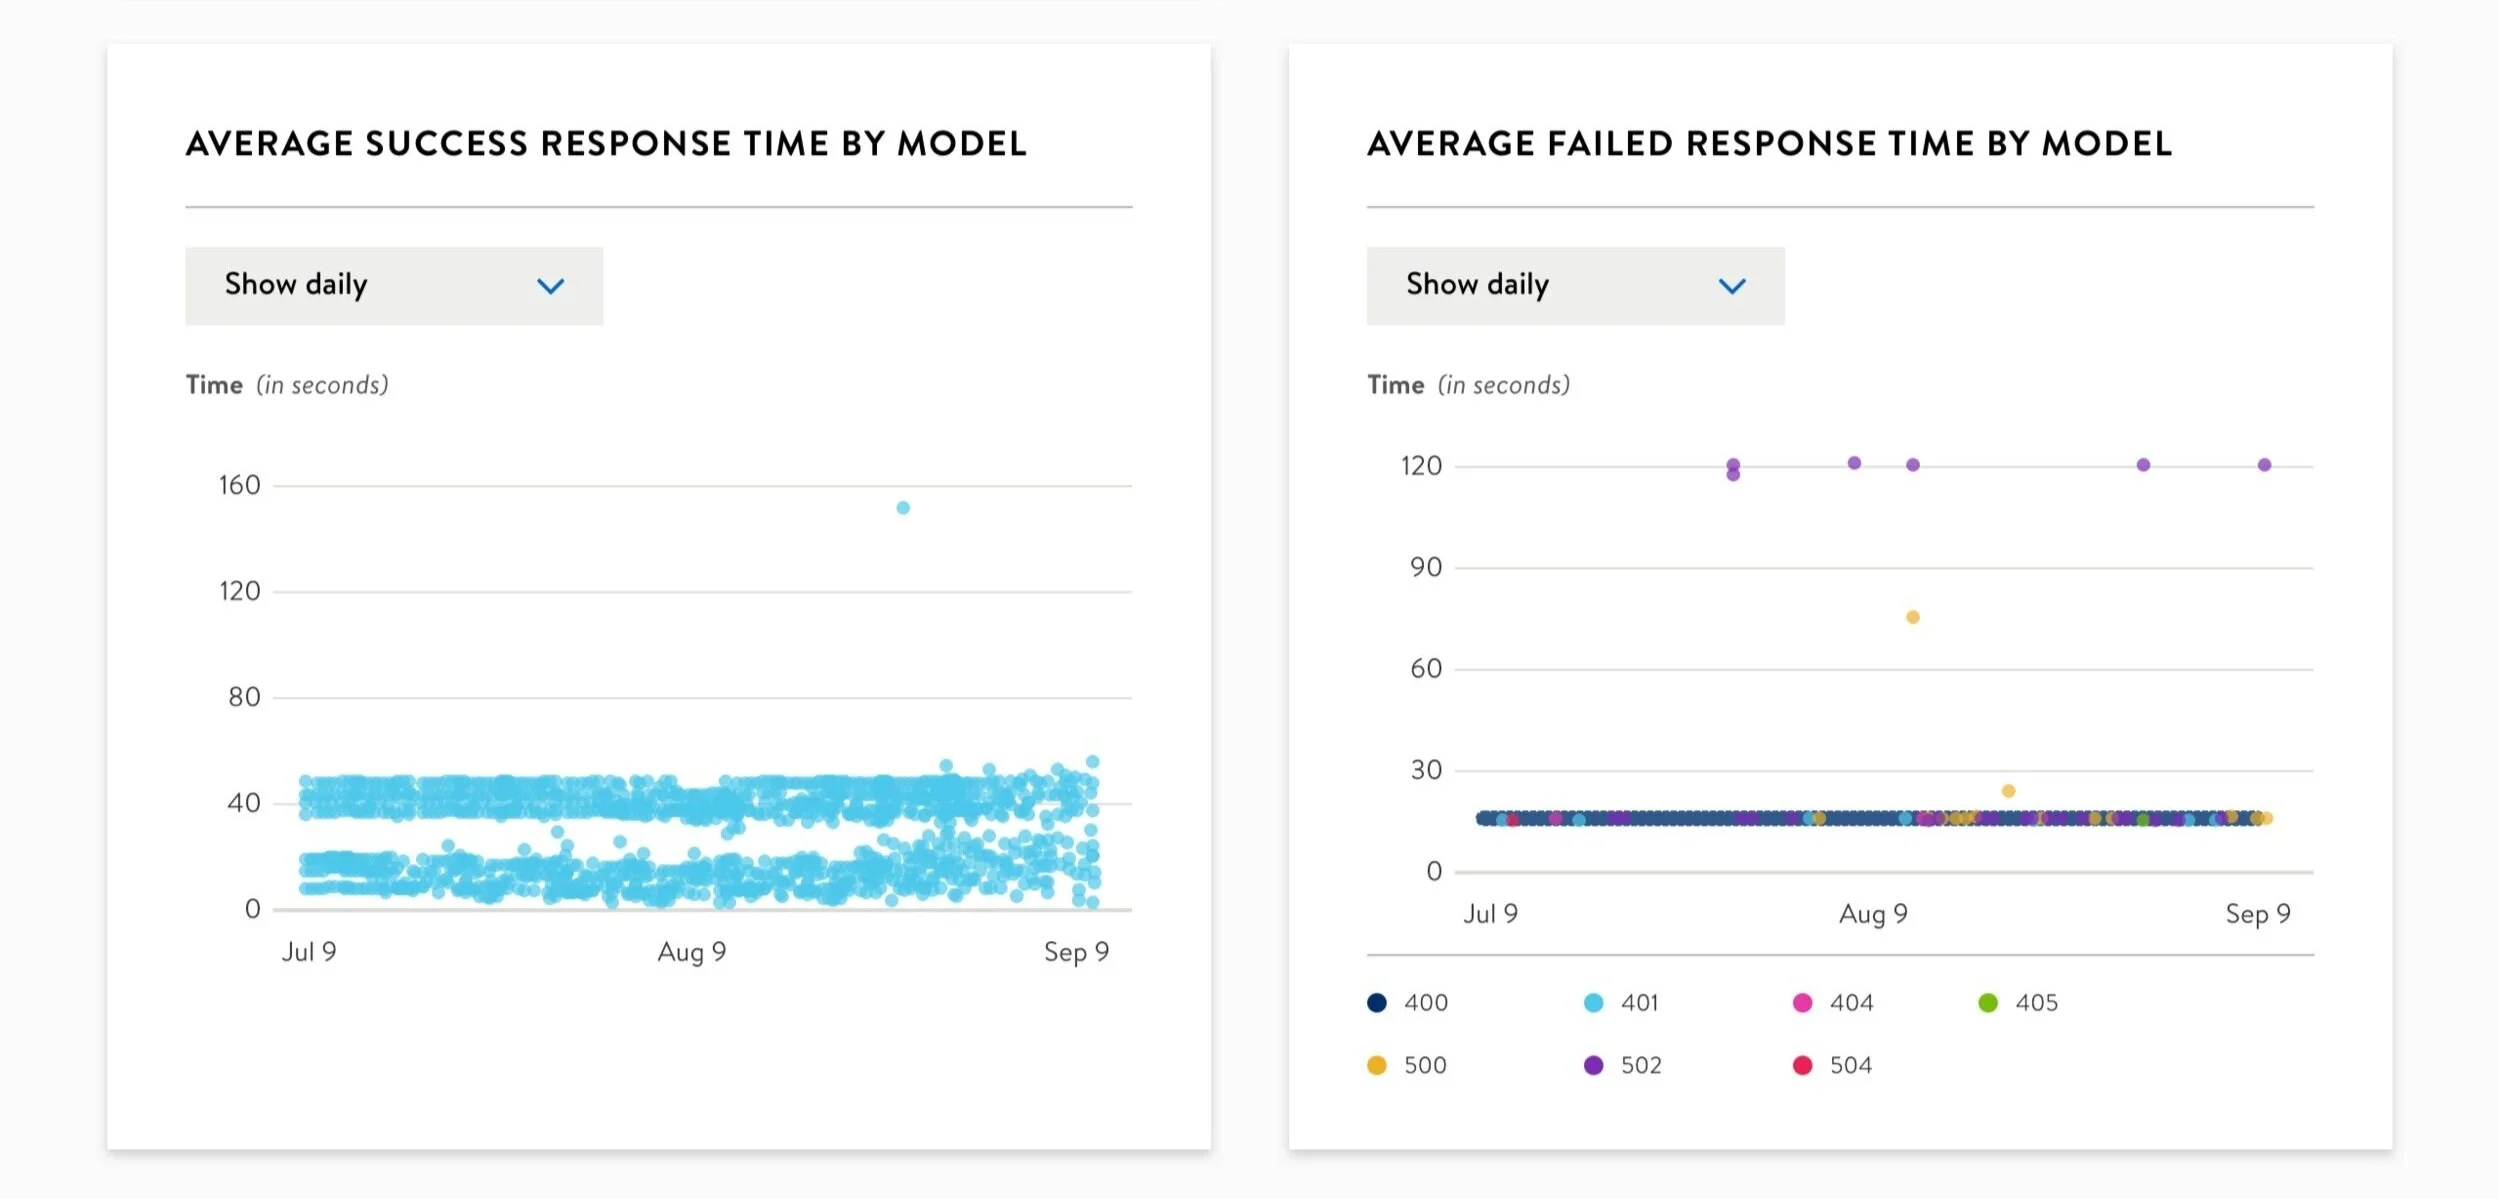
The engineer and I on this project ideated on many visualizations and ultimately decided we needed to ensure any visuals would highlight outliers clearly so people do not have to go hunting for them. That focus led the direction of the designs.
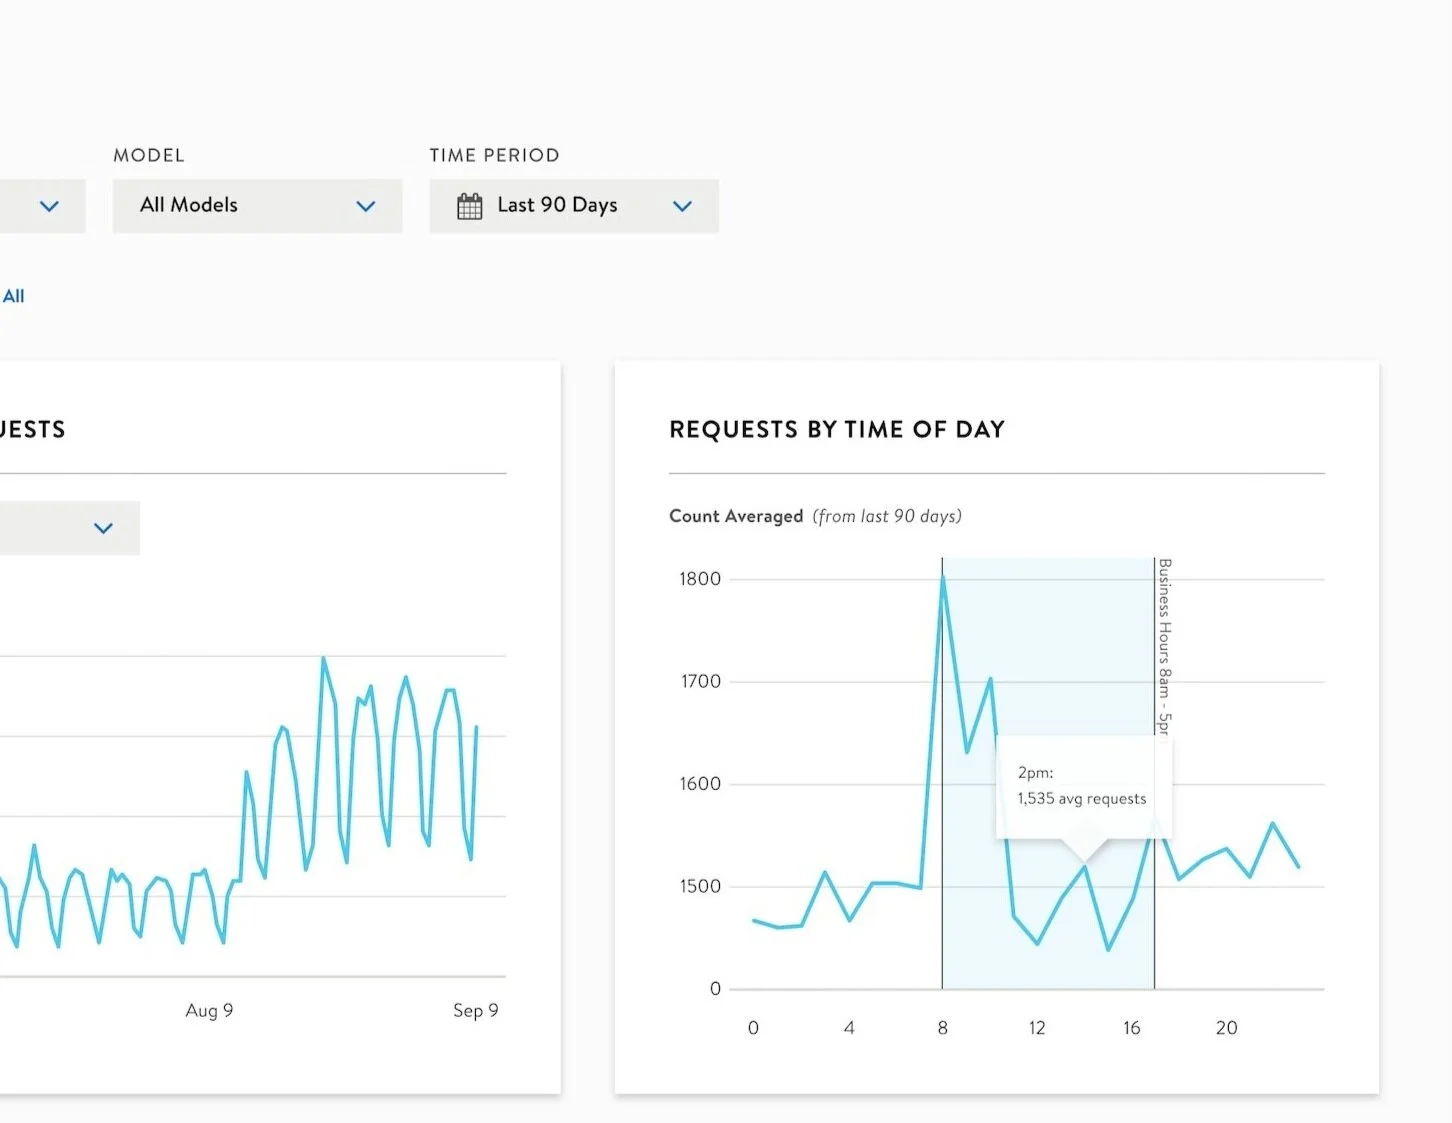
Providing contextual information
Helps someone zone into the important hours of the day
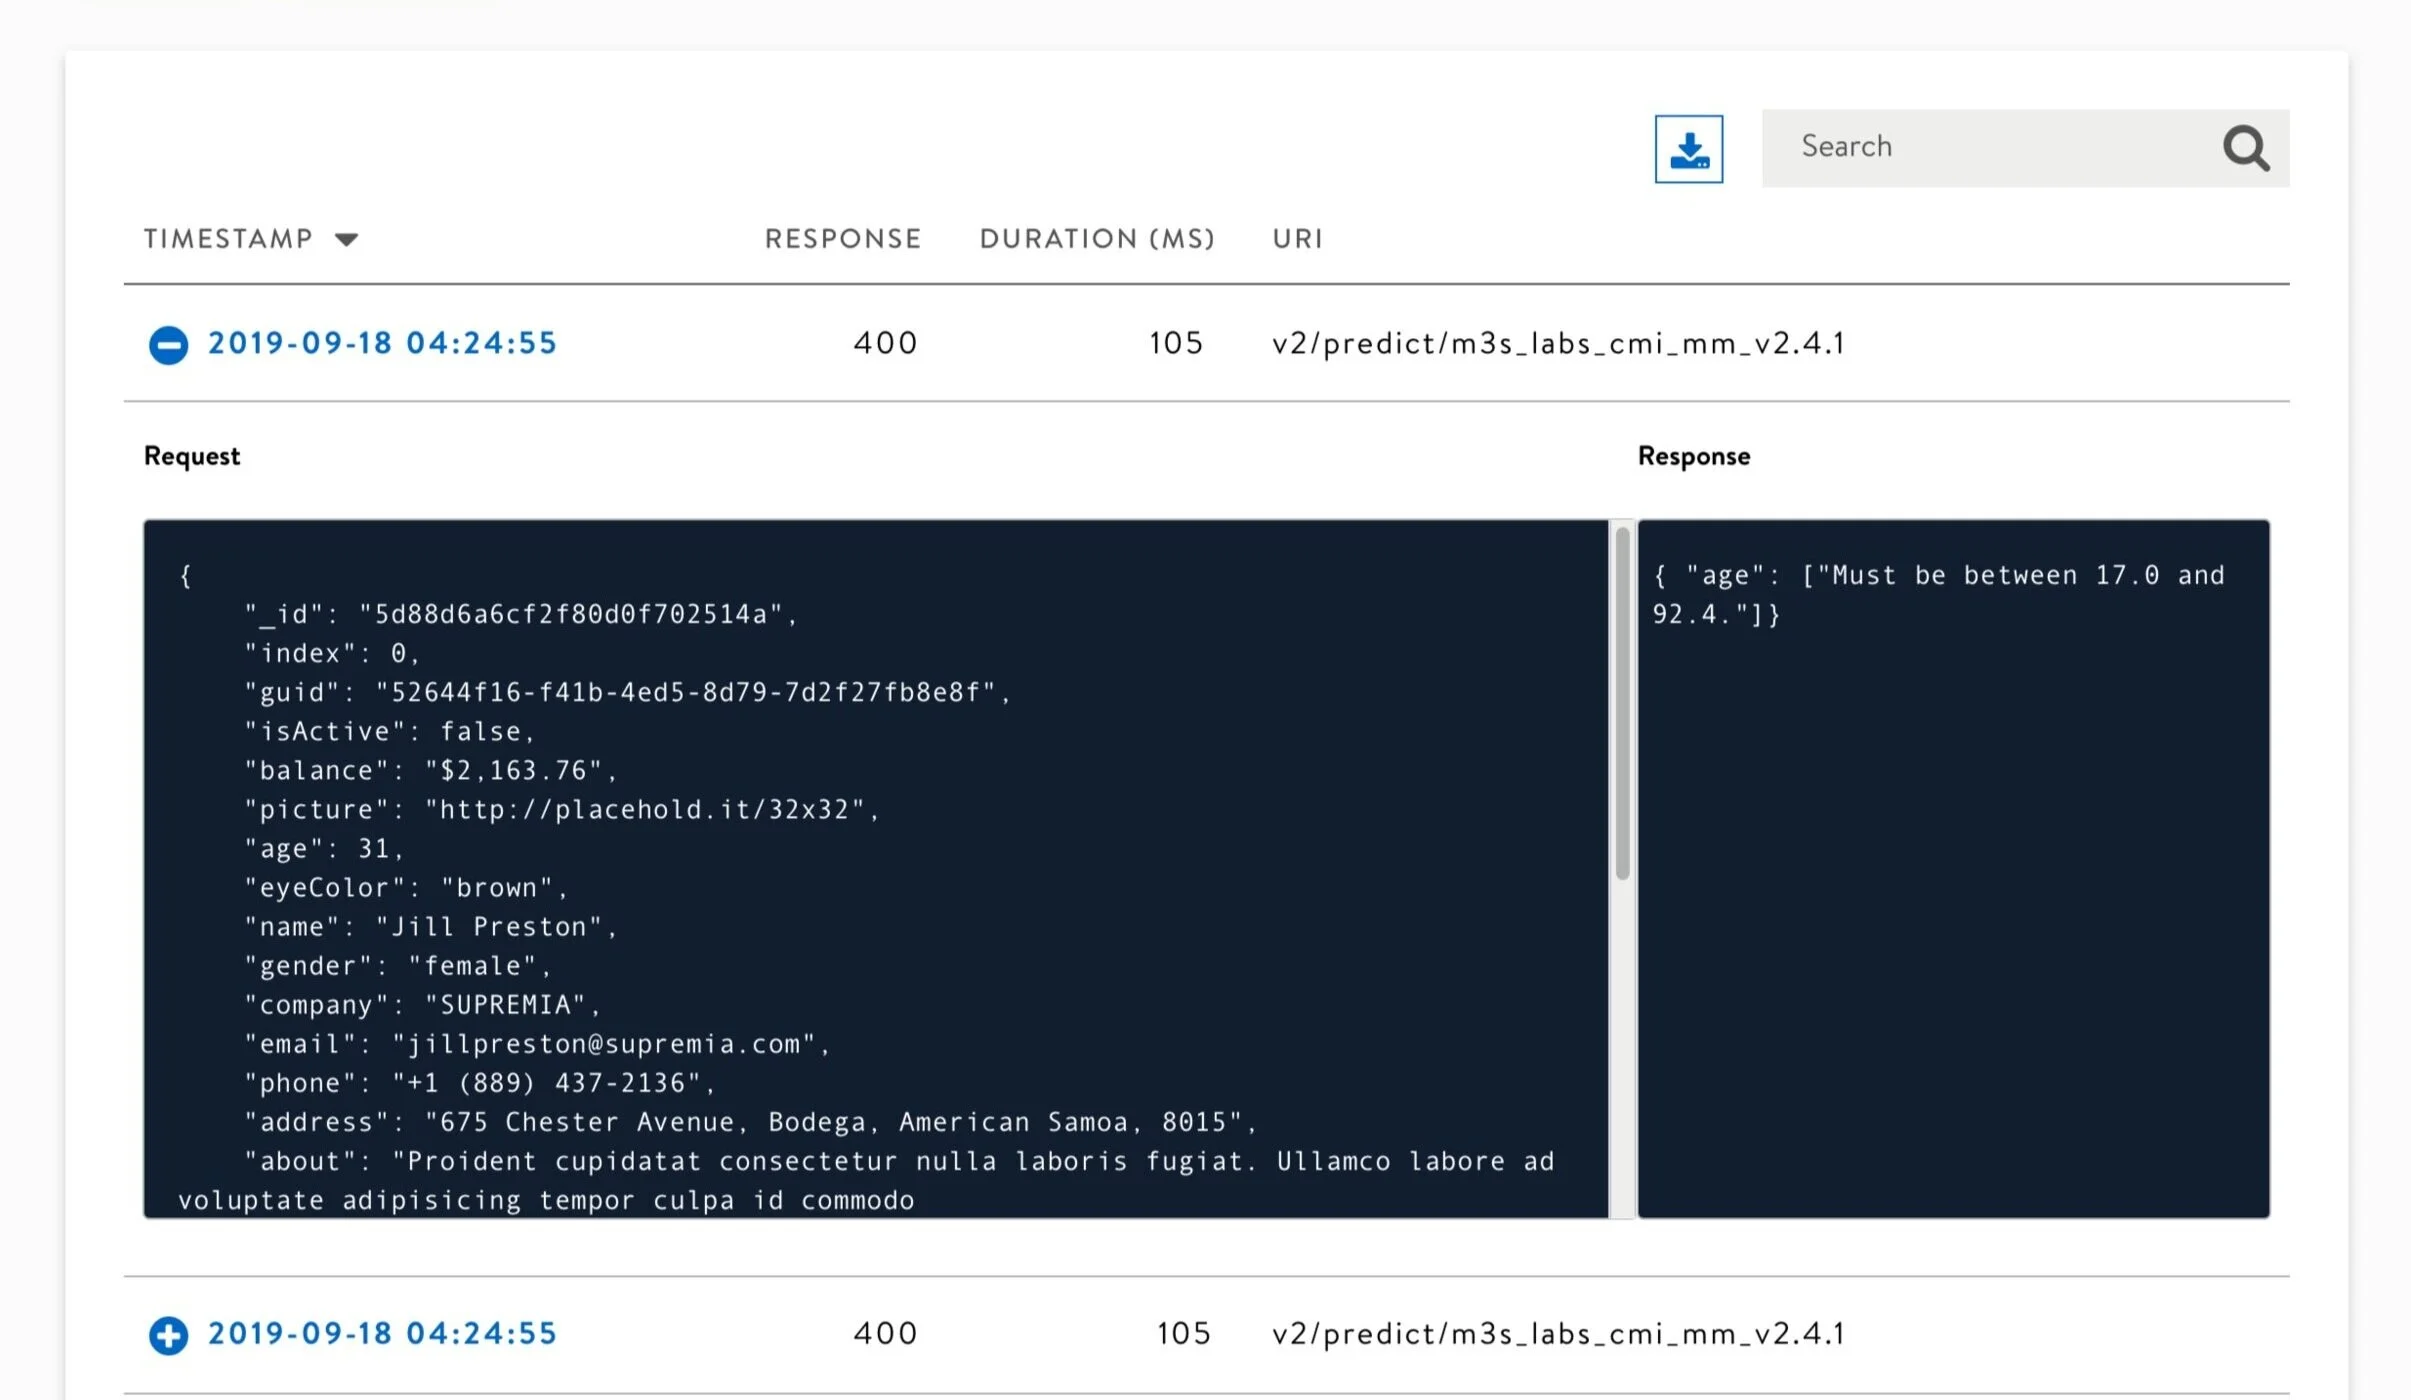
Find specific requests
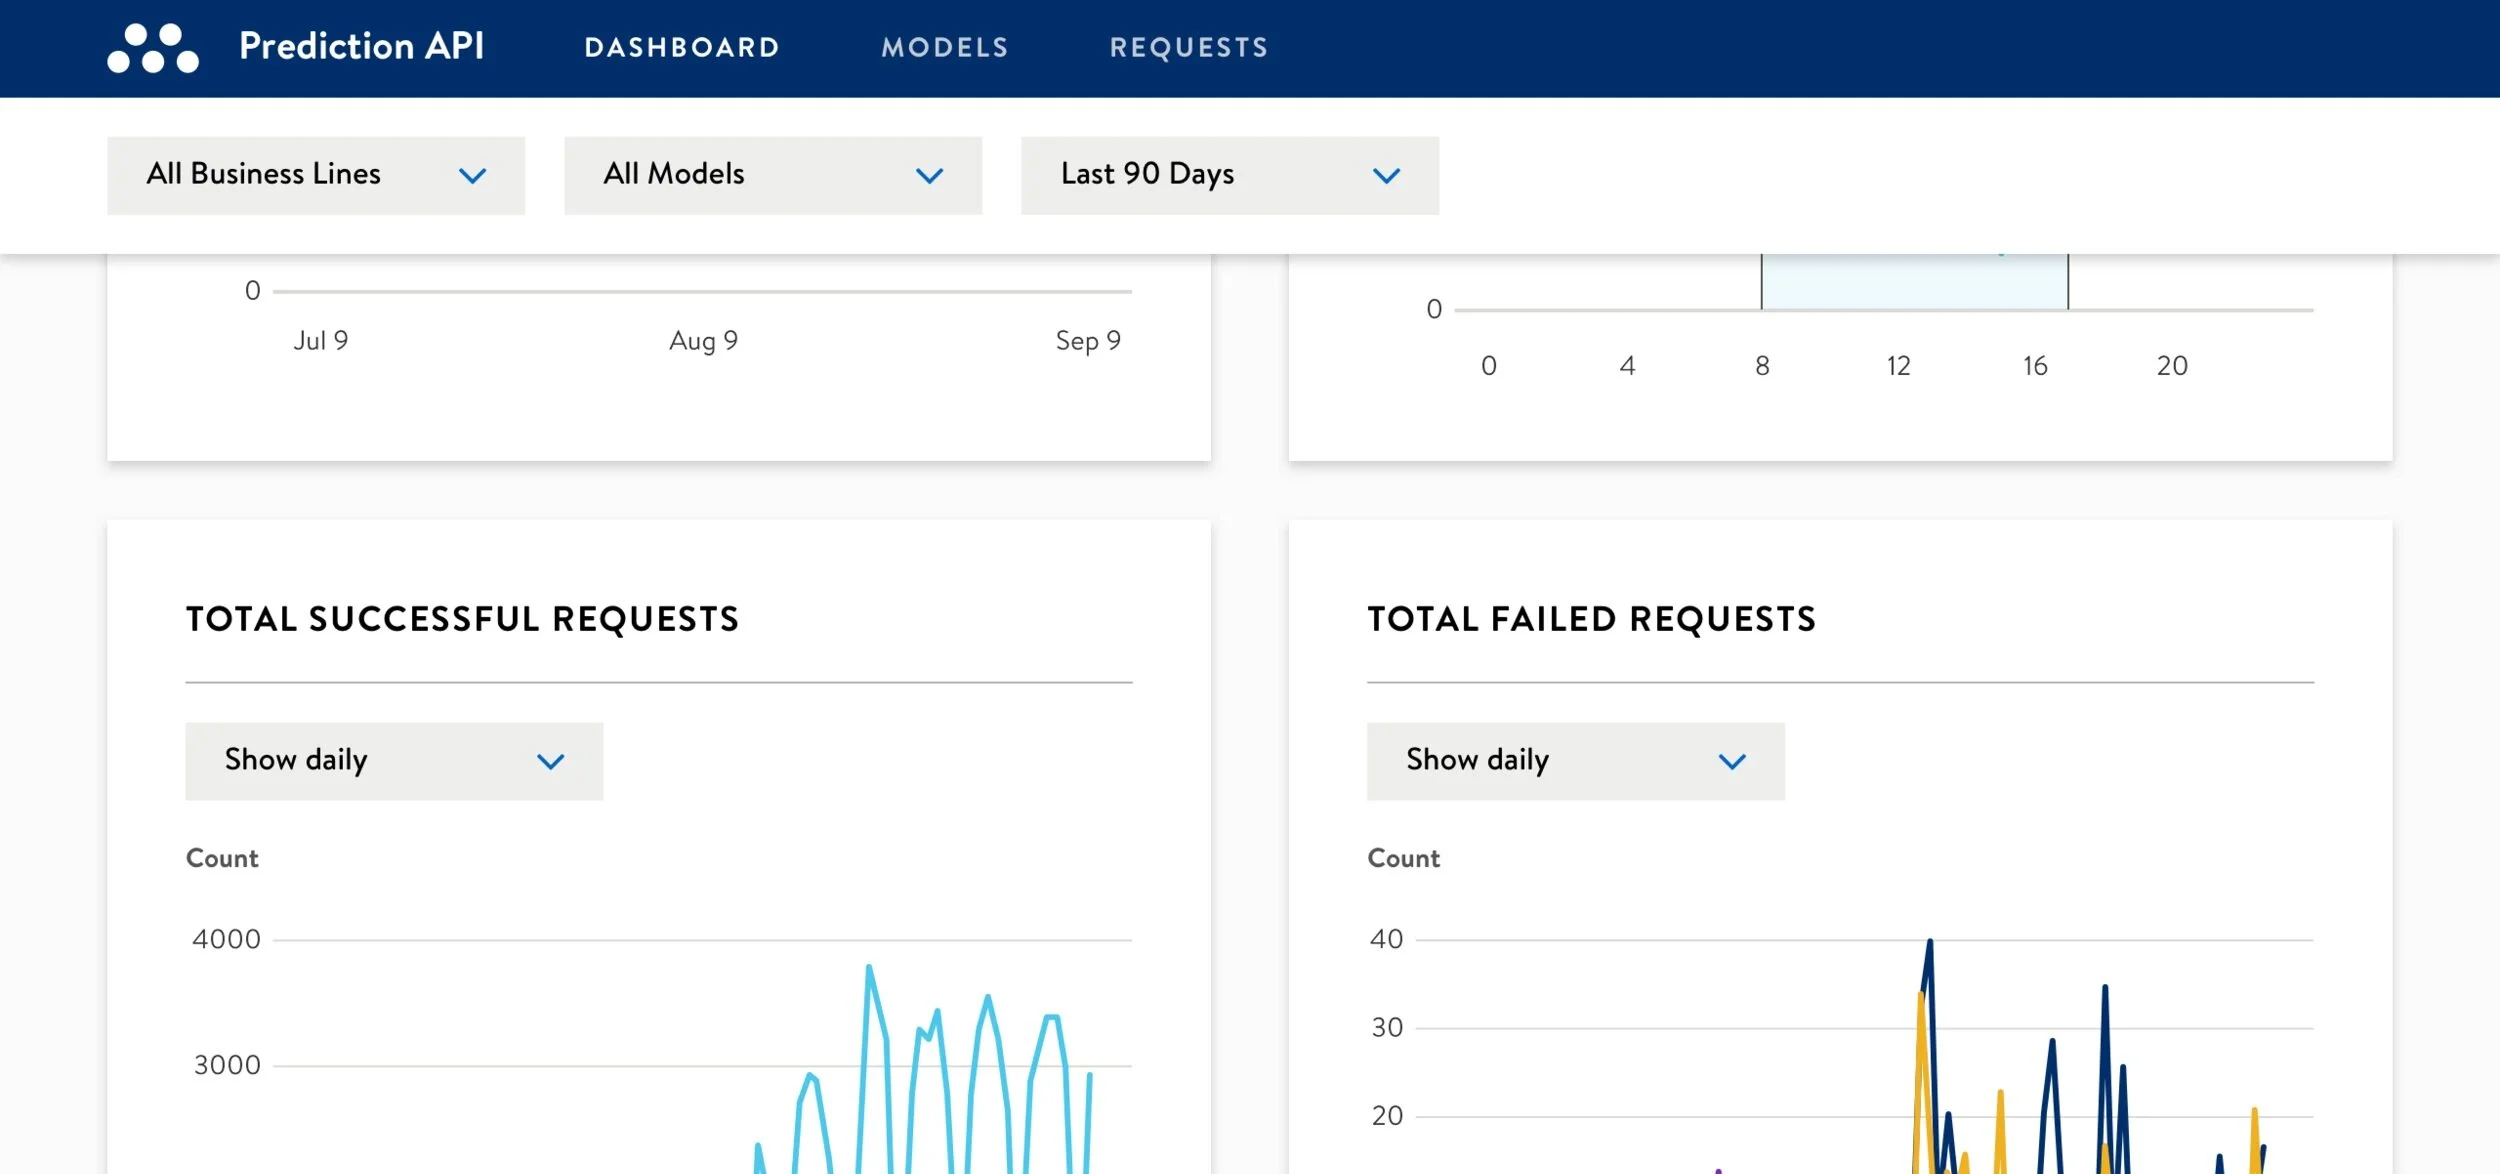
Filter anytime, at any point on the page
Find outliers easily
Next Steps
Add methods of proactive monitoring through threshold settings, alerts, and predictive visualizations.
The engineer and I worked together to build a simple dashboard of information that helps people locate issues if they are looking for it. Our next steps will be to add methods of proactive monitoring through threshold settings, alerts, and predictive visualizations so our department can stay ahead of any issues without constant monitoring.


